Creating a Analytics Widget in Wavity
- Widgets in Wavity are interactive components or visual elements within a user interface (UI) that provide users with specific functionalities, data visualizations, or quick access to information and actions.
- Widgets can be added/edited to interfaces/dashboards in Wavity platform. This feature allows you to customize dashboards based on your requirements. For more details on creation of dashboards, please refer the following link: How To Create Role-Based Interface/Dashboards/Layouts | Wavity
- An Analytics Widget is used to display pre-built analytics or visual reports from a specific application directly on your interface. It provides users with a quick snapshot of meaningful data insights, helping them make informed decisions without leaving the dashboard.
- Only an Admin of your organization has the access to create or update widgets in Wavity.
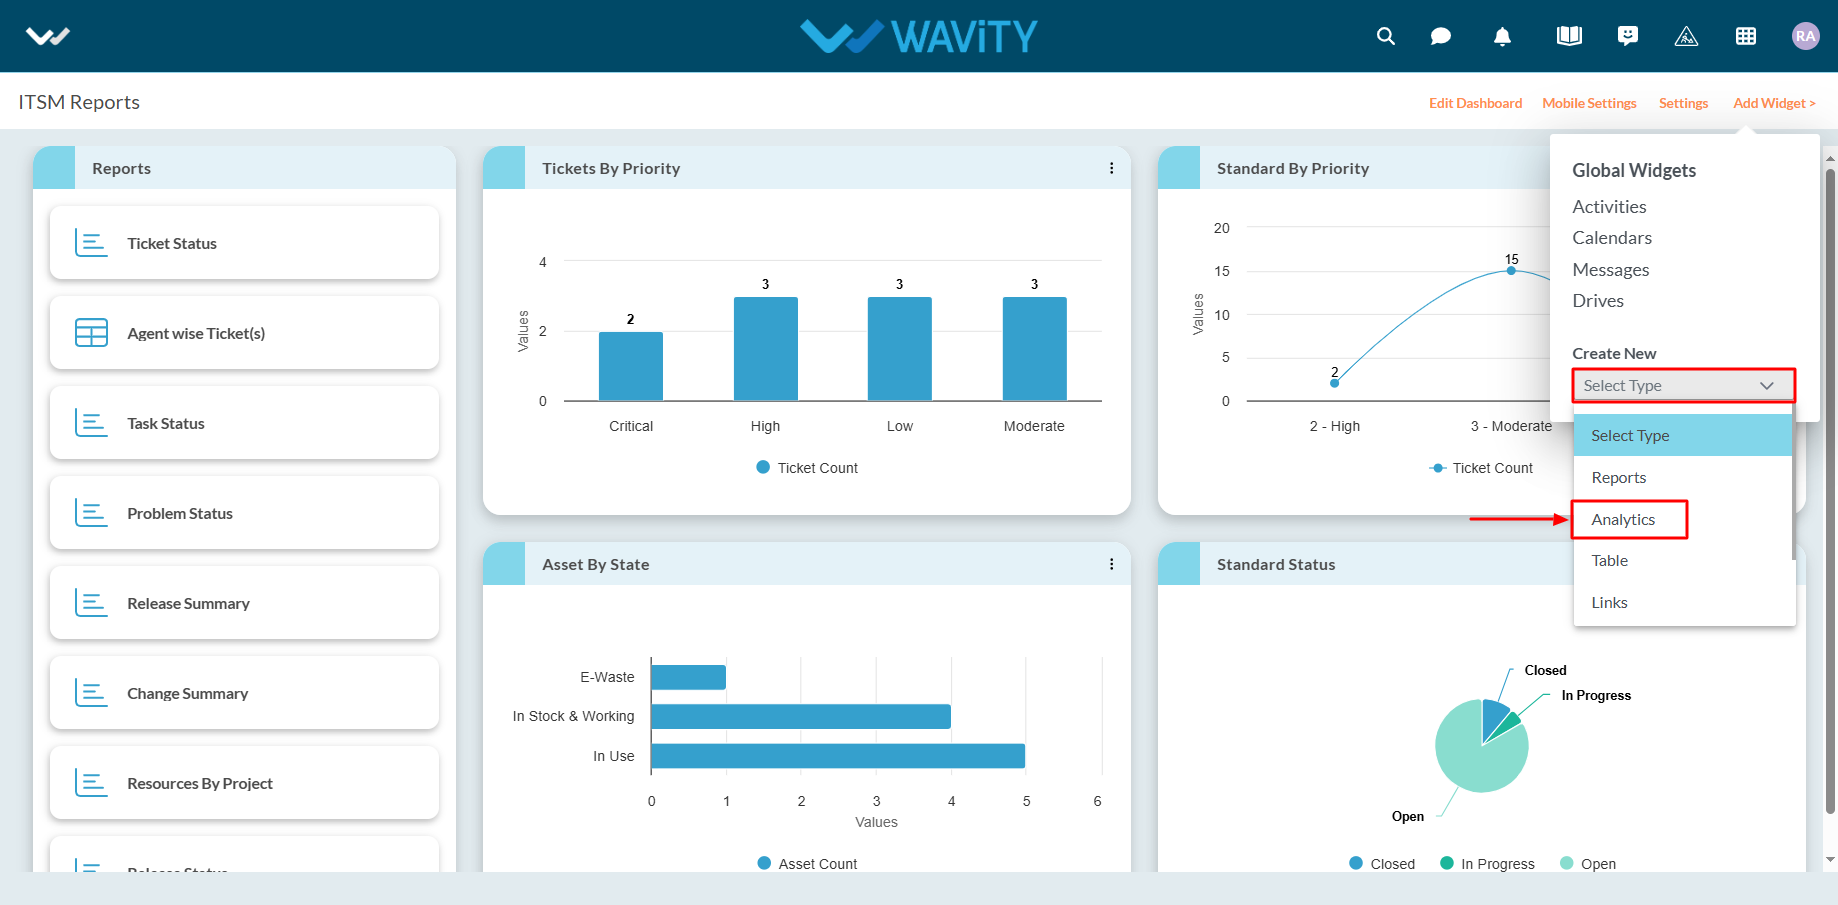
- To create a Analytics widget: Click on “Add Widget”, then select “Analytics” from the Create New dropdown menu.
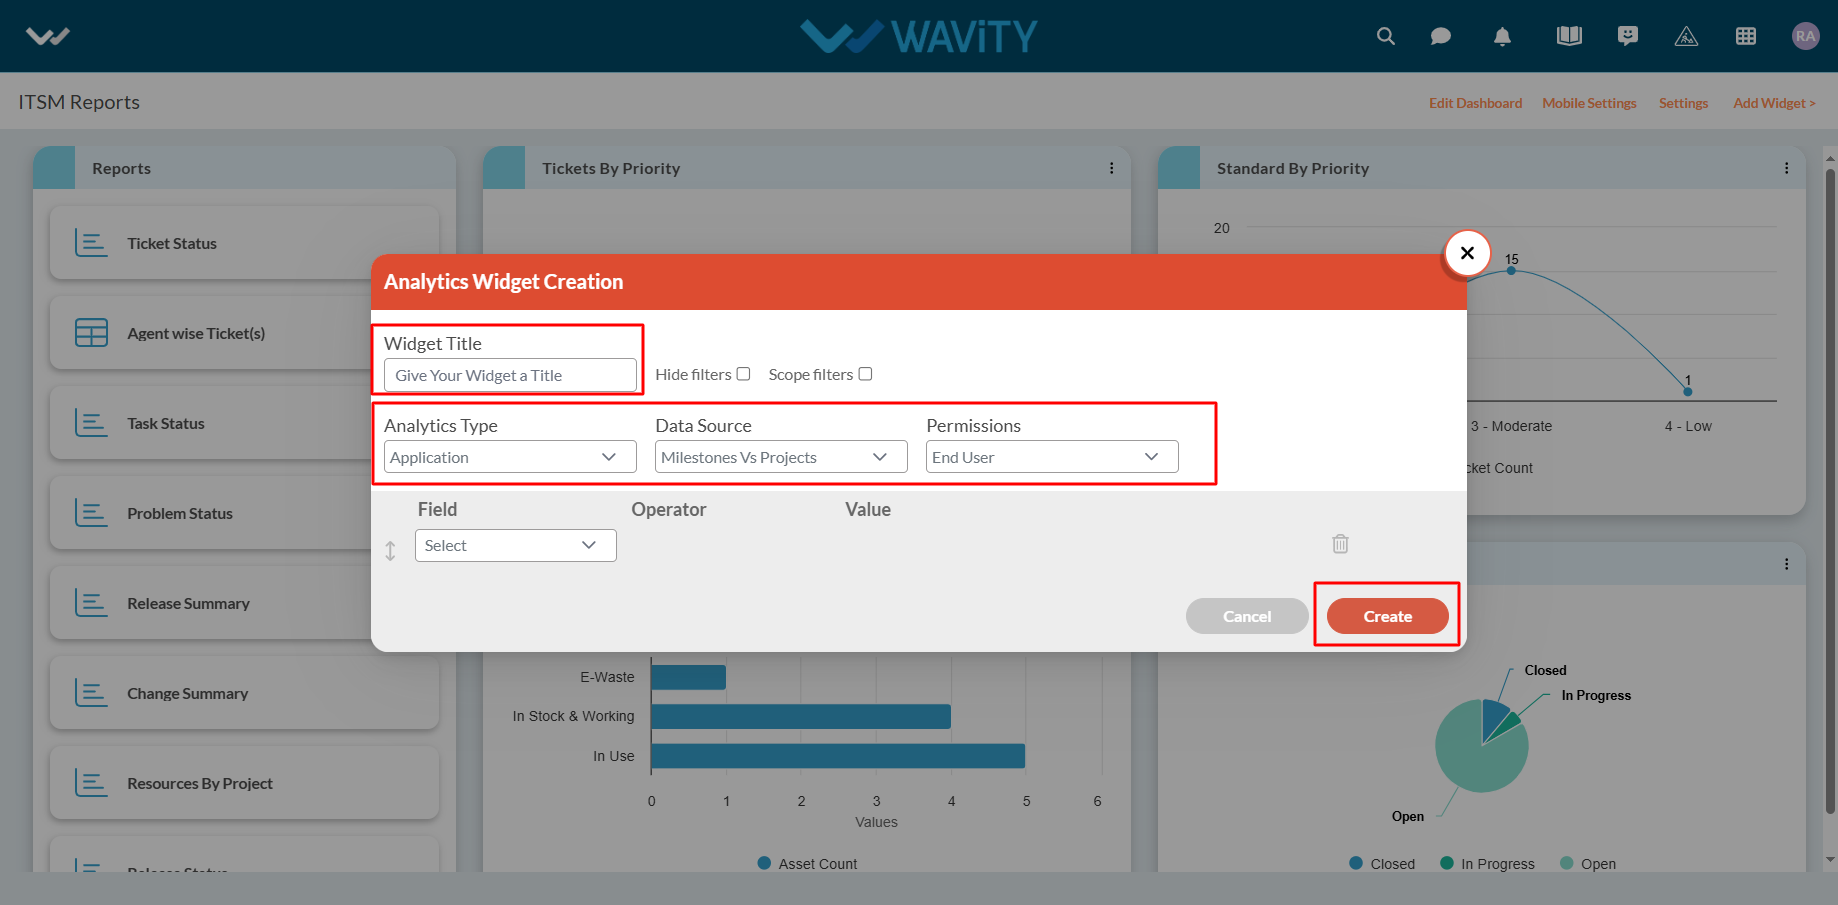
- Enter a Title for your Analytics Widget.
- Choose the Application from which the widget will pull existing analytics.
- Select the specific Analytics item you want to display from that application.
- Choose the User Category (e.g., End User, Approver, Manager, Moderator) to define who can view or interact with the Link Widget. Permissions are based on the selected data source application.
- Once all configurations are set: Click Create to generate a new Analytics Widget or Click Save to update an existing one.
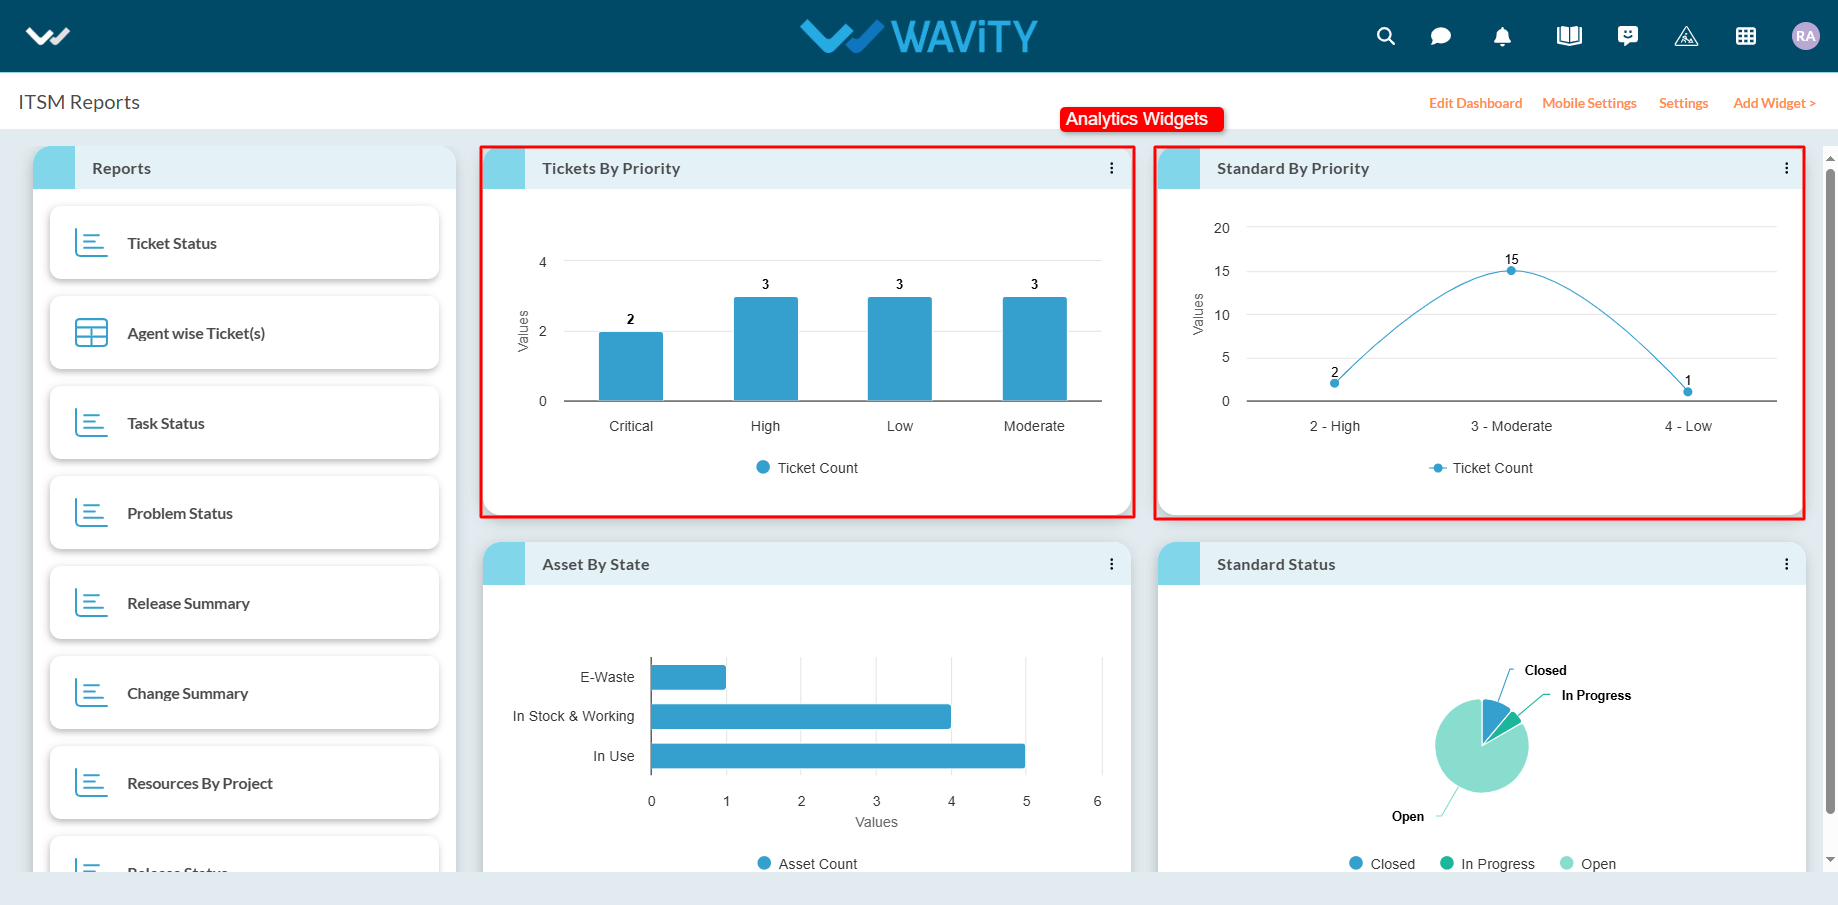
- Here’s an illustration of how an Analytics Widget will appear in the interface: